
Science of the Comstock - Earth Science
Home | Tour | Physics | Chemistry | Earth Science | Environment | Scams | Lesson Plans
Earth Science Topics:
Introduction | Mapping | Local Geology | Regional Geology
Mapping
Introduction/Contour Maps
It can be said that maps are to the Earth scientist as money is to a banker. Maps provide a medium to document the smallest features of a crystal lattice or the grand landscape of an entire ocean basin. This unit addresses notions of mapping certain dimensions of the Earth's space and time.
By Lindsay Craig
Objective: At the end of this lesson you will be able to read and model contour topographic maps.
Reason: Topographic maps are highly useful and have a broad range of potential applications.
Activity #1. In a complete paragraph answer the following questions:
What different ways have you used maps? Where were you and what were you doing? Think of other people who used maps, why did they use them?
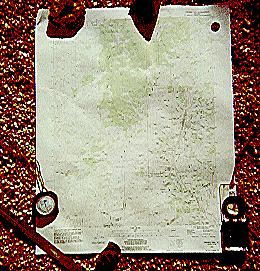
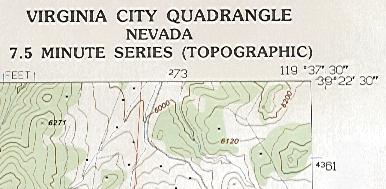
The above image is of a standard 1:24,000-scale U.S Geological Survey (USGS) topographic contour map (paper copy) of the Virginia City quadrangle, Nevada. Note the altimeter, the compass and the quarter (upper right corner) for scale. On these maps topography is displayed through use of contours. Contours are lines of equal elevation. You will soon have the opportunity to examine this map in closer detail.
These are three of the main reasons to learn how to use topographic contour maps:
--They are among the best maps available for determining your position on the Earth's solid surface.
--These maps supply valuable position, landform and cultural information for everywhere in the country.
--The principles of topographic contouring are used with other business and scientific applications to display data spatially.
If you were trying to get to the Comstock Lode 140 years ago to stake your claim and get rich, your way would have been difficult and dangerous. You would have had to cross a vast wilderness on foot or by horse. A simple sketching for a map would be the best you would have to help you along the way. There were no highways and no cars. Imagine having to travel across the country without a real map and having to walk or ride a horse the entire way. As the wilderness became explored and settled, maps became increasingly detailed. There was a strong need to have the land mapped and surveyed. Topographic or contour mapping was developed to represent the three dimensional (3D) character of the landscape on paper, which is a 2D medium. These maps became an instant success because they could be used by anyone, including the traveler, engineer and geologist alike. Modern public domain topographic maps are available for every portion of the United States. These uncopyrighted maps are produced by the United States Geological Survey and are available at several different scales at affordable prices.
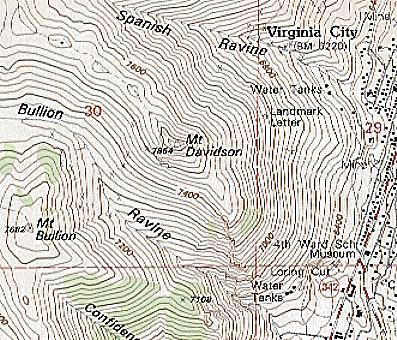
A small portion of the USGS Virginia City topographic map is shown; it includes Mt. Davidson (7864 feet above sea level) and Mt. Bullion (7682 feet above sea level). The contour interval is 40 feet, or in other words the elevation change between each line is 40 feet. Notice that there are bold lines at even 200-foot contours, such as the 7000-foot contour interval. Also notice that along ridgelines the contours make a "V " pattern that points outwards from the ridge. In ravines the contours point into the ravine. The patterns look the same but the "V" along the ridges point horizontally into the air while those in the creek point horizontally into the ground.
Compare the ridgeline that leads from the northwest towards Mt. Davidson; in your own words how is it different from Bullion ravine and yet how does it look the same (think about what was stated above)?
Activity #2. Using a sheet of notebook paper create a map using 10 foot contour lines to make two ridges separated by a ravine, make one ridge line 200 feet high and the other 100 feet high. Label your lines and make your lowest elevation sea level or zero feet elevation. Can you visualize the shape of the terrain you just created? To get a real look at your topography in 3D trace each contour line onto a separate piece of cardboard, you can use a pencil or pin to poke holes through the paper into the cardboard, then connect the dots and cut along the lines. Glue each layer into place one on top of the other. By doing so you create a 3-D model of your map. Save your map for an activity later in the lesson.
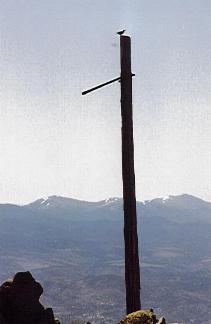
Above is an image of one of the flagpoles at the top of Mt. Davidson. Note the snow on the mountains in the background. The flagpole dates to the late 1880s and was forged in a local Virginia City foundry.
Mt. Davidson is a topographic high and can be considered an elevation anomaly. The contour lines for any mountain make a series of rings that get smaller with increasing elevation (go back and look at the topographic map of Mt. Davidson). In nature, anomalies happen for a reason and they are often the result of some special situation or occurrence. The reason that this mountain is a topographic high is because it is made of harder rock than the surrounding area. In this case the rocks at the top of the mountain are intrusive rocks (an extinct or frozed magma chamber)surrounded by soft volcanic rocks. Different rates of erosion are due to the different rock types; a mountain forms where there is hard rock and a valley forms where there is soft broken rock. The Comstock Lode formed adjacent to Mt. Davidson where the underlying rock is soft and valley terrain and low land dominates. In addition, Mount Davidson and the Virginia Range are higher than the surrounding valleys as a result of faults that dropped the valleys relative to the mountains.
Activity #3. Shaded relief maps utilize topographic information and present it in a different form from that of the traditional contour map by the use of coloration and shading. Draw one of these maps at the site link listed below:
http://www.nationalatlas.gov/scripts/start.html
1. At this site zoom-in on the State of Nevada.
2. Click the following layers:
States
Shaded Relief
Streams and Water Bodies
Cities and Towns.
3. Click on "Download" and view the map.
4. Write a paragraph describing what you observe about the Nevada shaded relief map. Is Nevada flat, or does it have mountains; what happens to the rivers that flow in interior Nevada? Does Nevada have more mountains or more valleys? Is there a grain to the land? These are some of the questions to consider when writing your paragraph.
Positioning
By: Lindsay Craig
Objective: You will also be able to plot latitude and longitude positioning grids and locate specific localities.
Reason: Latitude and longitude positioning grids are the most common positioning grids in use worldwide; everywhere on the Earth's surface can be defined by latitude and longitude.
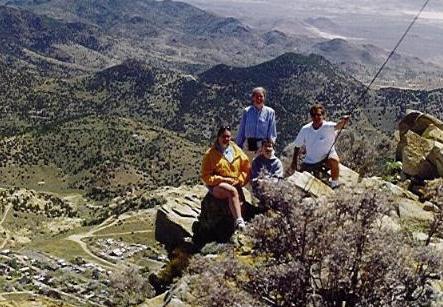
The above image shows the view from the top of Mt. Davidson looking down on a portion of Virginia City (lower left). Four of the five authors of this web site are shown. Imagine that you were at the top of Mt. Davidson hiking and taking in the spectacular view with your best friend and a thunderstorm rumbles in. Lightning bolts start cracking all around you, and your friend takes a bolt. You grab your cell phone and call for help. The dispatcher needs your position in order to send help. Instantly with a topographic map or a Global Positioning System (GPS) receiver you would be able to give the dispatcher exact and certain latitude and longitude coordinates; help's on the way. This is just one example of how positioning can be important. Global positioning helps people get jobs done, and some of these people are navigators and Virginia City surveyors. Who else uses positioning and maps?
People have created numerous systems for describing exact positions for anywhere on the Earth's surface. The United States Geological Survey (USGS) developed different topographic maps that utilize numerous useful positioning grids including Latitude and Longitude, Universal Transverse Mercator, Township and Range and Nevada Coordinate System (Nevada only). All of these are useful, but for our purpose only Latitude and Longitude will be discussed because it is the most widely used system of positioning worldwide.
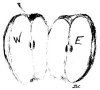
Slice an apple in half through its stem and you have created an east half and west half along a longitude cut. Put the apple back together and slice it in half perpendicular to the longitude cut. You have now created an equator or latitude line that separates the apple into north and south halves. With these two cuts have you created halves, quarters or thirds? By convention these sections are referred to as the NE, NW, SE and SW sections.
Longitude lines projected onto the Earth trace a straight line from the North Pole to South Pole. Longitude lines are based on degrees where there are 360 degrees to a full circle. There are 180 longitude lines on each half of the Earth. The zero degree longitude line is called the Prime Meridian and it was randomly chosen to pass through Greenwich, England. At this place you can put one foot on the east half of the Earth and one foot on the west half of the Earth.
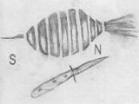
Latitude lines, on the other hand, measure from zero degrees at the equator and are evenly spaced both in the north and south hemisphere to 90 degrees at the poles. From the equator, each equally spaced slice gets smaller as the latitude lines get shorter. This is similar to the slicing of a beet as shown in the sketch below; the smallest slices are at the ends.
Shown in image below are the major continents and oceans in a worldwide view displaying the relationship of longitude to latitude. In this sketching, the Earth's surface has been "peeled off a globe like an onion skin and pasted to a flat surface." Slices of longitude have been distorted into curves while lines of latitude remain as straight lines. Lines of latitude are greatest in length at the equator and progressively get shorter towards the poles. To keep the terms latitude and longitude straight it helps to remember that longitude lines are always "long" and latitude lines are always "lateral." Lateral means "sideways." On the sketching both longitude and latitude lines are drawn every 15 degrees. If this image were pasted back to the globe the longitude line on the right side would be the same line as the one on the left side.
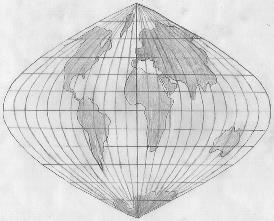
The Earth's shape is that of a ball or globe. To go around the equator and return to the same point, one would pass through 360 degrees of angular separation and each degree of longitude would be crossed at equal intervals. To circle the globe along longitude start at the equator on the vertical straight line; this is called the Prime Meridian, in the middle of the image. Then go south to the pole; then follow the outside line on the right side to the North Pole. Then go south along the same middle line back to the equator. You just circled the globe! Now how can you circle the globe along latitude? At the equator start all the way to the right and then go all the way to the left side. Now you can see how flat maps can represent curved surfaces.
Latitude and longitude degrees are further divided into minutes and seconds. Each degree has 60 minutes (60'), and each minute has 60 seconds (60"). Virginia City and the Comstock Lode are roughly positioned at a longitude of 119 degrees, 39 minutes west (119° 39' W) of the Prime Meridian and at a latitude of 39 degrees, 18 minutes north (39° 18' N) of the equator. When using seconds, specific points or features can be accurately located, such as the courthouse or a certain cultural feature like a mineshaft.
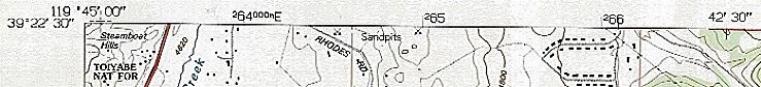
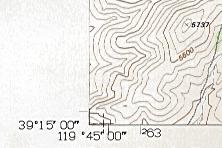
The upper left corner of the Virginia City topographic map is shown above. Latitude and longitude mark the exact coordinates of each map corner. To the right on the image, 42' 30" is posted above a tick mark, this mark locates the position of 119 degrees, 42 minutes, 30 seconds west longitude. The same longitude tick marks show up on the bottom of the map. All around the map edges there is either a latitude or longitude tick posted every 2.5'; these, coupled with the map edges, define the map's latitude and longitude grid. Longitude is always posted at the tops and bottoms of these maps, while latitude is posted on the sides. (The north arrow points to the top of the map.) Note that the 39° 22' 30" latitude line is shown in the corner of the map.
The upper right corner of the Virginia City topographic quadrangle map is shown above. The latitude and longitude coordinates are posted for the map corner. What number changed between the two upper corners, latitude or longitude? For the numbers that changed, their difference is 7.5'. Between the upper and lower edges of the map a similar latitude difference of 7.5' occurs (also see the images below). Because of this the map is titled, "7.5 Minute Series (Topographic)". In other words, the USGS has produced a series of maps that have boundary clips every 7.5' . They also produce other map series with 15', 1° and 2° clips; these maps cover progressively bigger areas, but become less detailed as they get bigger.
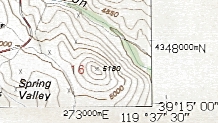
Shown here are the bottom corners of the map. Can you predict how many latitude plus longitude coordinate grid lines are on the map, 2, 4, 8, or 12? Can you determine how many single coordinate tick marks are on the map, 6, 9, 12, or 16? Finally, if you connected all of the opposing tick marks with lines across the whole map how many lines, including the map edges, would you have for establishing a grid 6, 8, 10, or 12?
Activity #1. Using the topographic map that you made on notebook paper in the previous lesson, create a latitude and longitude grid system for your map Do this for a position south of the equator and east of the Prime Meridian (the opposite side of the world). Model your grid to the 7.5-minute topographic map example shown above.
End of Lesson
Time Zones
By Lindsay Craig
Objective: By the end of this lesson you will be able to determine the rough position of the time zones from your knowledge of longitude.
Reason: It becomes important to know what the local time it is when communicating with someone in another time zone or when traveling to other time zone.
Time zones are related directly to the Earth's longitude position. In a day there are 24 hours, during this time the Earth makes one full rotation on it's axis. From where we stand the sun and stars seem to move across the sky from east to west because the Earth rotates in the opposite direction. As we see it the sun rises in the east, climbs into the sky and sets in the west only to rise again in the east and so on again and again.
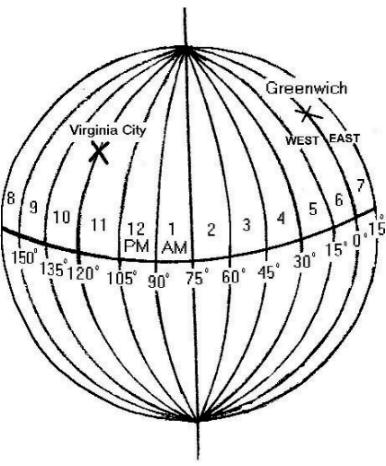
The above image portrays only half of the Earth's surface. We know that the Earth has 360 longitude lines degree of angular separation around the globe. For every hour that passes the Earth rotates eastward by 15degrees.
Imagine you are on the Prime Meridian, in "east" Greenwich, England; it is summer, at 5:00 AM, and the sun is rising. A zone 15 degrees wide from the North Pole to the South Pole is at 5:00 AM at the very same moment. To the west, the Atlantic is in the dark; so is most of North America. In Virginia City the time at that same moment is 10 PM, it is dark and most of the night is ahead. There is an 8-hour time difference between the two cities and it will be eight more hours before it is 6 am in Virginia City. Knowing this information, imagine yourself looking down on the Earth and you are above the North Pole, what direction would the Earth be spinning, counter clockwise or clockwise?
This image is a close approximation of where the time zone breaks exist. If each line were viewed in actual detail, one would find that they are controlled by political boundaries such as state or country lines. One country in particular, the Cook Islands in the South Pacific, really wanted to be different from the rest of the world and by declaration their time zone is one half hour off from the rest of the world. Because of the political boundaries imposed on time zones, the method used above is only good as an estimate of the time in any one locality. Further, the above model shows Virginia City on the west side of a particular time zone based on latitude, however the political boundaries imposed moved it into the time zone to the west . This time zone is named Pacific Standard Time. In the continental U.S. from west to east there are three other time zones, Mountain Standard Time, Central Standard Time, and Eastern Standard Time.
Activity #1: Print out or sketch the image above, flip over the printout and trace in the lines of longitude on the back side of the paper by putting the printout to a window or light table. Imagine you are looking at the backside of the image shown above and write in the times and the degrees of longitude for your tracing.
Use this tracing to answer the following questions:
1. What is the time at 171 degrees west longitude when it is 12 PM in Virginia City?
2. Hawaii is between 150 and 165 degrees west longitude, what is the time there when it is 3 AM in west Greenwich?
3. When it is 4 PM in Hawaii what time is it at Virginia City?
4. Sydney, Australia is between 150-165 degrees east longitude; the Canary Islands are on the opposite side of the world between which longitude lines?
5. Examine the time zone that is 105-120 degrees west of Virginia City. List the time when it is 5 AM in Virginia City? Does this time zone have the date as that of Virginia City?
Click here to check your answers.
Activity #2. To learn more about current real world times across the globe visit these sites at:
http://www.timeanddate.com/time/map/
Write a paragraph about each web site describing what you observed.
End of Lesson and End of Unit
Mapping Quiz
Your name:
1. Topographic maps are highly useful to engineers and surveyors
True
False
2. The applications that topographic maps are useful for are:
landform modeling
positioning;
providing a mapping base
all of the above
none of the above
3. Longitude lines intersect.
True
False
4. Latitude lines intersect.
True
False
5. Latitude lines are always the same lengths; longitude lines are always different sizes.
True
False
6. Which is the most common positioning grid in use worldwide.
Universal Transmercator
Latitude and Longitude
State Coordinate
7. Latitude and longitude can be defined everywhere on the Earth's surface.
True
False
8. If you start at a point on the globe and follow one particular longitude line or latitude around the globe back to the point where you started, you will pass through 360 degrees of longitude or latitude.
True
False
9. Marked longitude and latitude divisions for a 7.5' USGS topographic map are located every 2.5 minutes (30" equals 0.5'). 120" equals 2'
True
False
10. Thinking on a global scale, where would topographic maps have sides that were nearly equal in length to the ends, at the:
Poles
Tropic of Capricorn
Equator
11. If you were in space and viewing the Earth from a stationary platform above the South Pole, what direction would the Earth appear to be turning?
Clockwise
Counterclockwise
Neither
12. Virginia City, Nevada lies between the longitude lines of:
105-120 degrees east
105-120 degrees west
120-135 degrees east
120-135 degrees west
13. Sixty minutes is to an hour as 15 degrees of latitude separation is to a:
Globe
Map
Circle
Time Zone
14.If it is 12:00 noon in west Greenwich, what time is it on the opposite side of the Earth?
12:00 AM
11:00 AM
11:00 PM
12:00 PM
15. What else can affect where a time zone boundary is placed?
Political Boundaries
Latitude Lines
Neither
Both
16. How many time zones are in the Continental U.S.?
four
five
six
seven
17. The Earth rotates to the:
East
West
North
South
18. Maps that cover bigger areas are usually more detailed than maps of smaller areas.
True
False
19. On a contour map, the contours along a ridge point outward and form a "V" pattern while in ravines the pattern is reversed and points into the ravine.
True
False
20. A contour map is a 3D model of a 2D surface.
True
False
 Home
Home